Punnett Square: How to Predict a Genetic Cross Step by Step
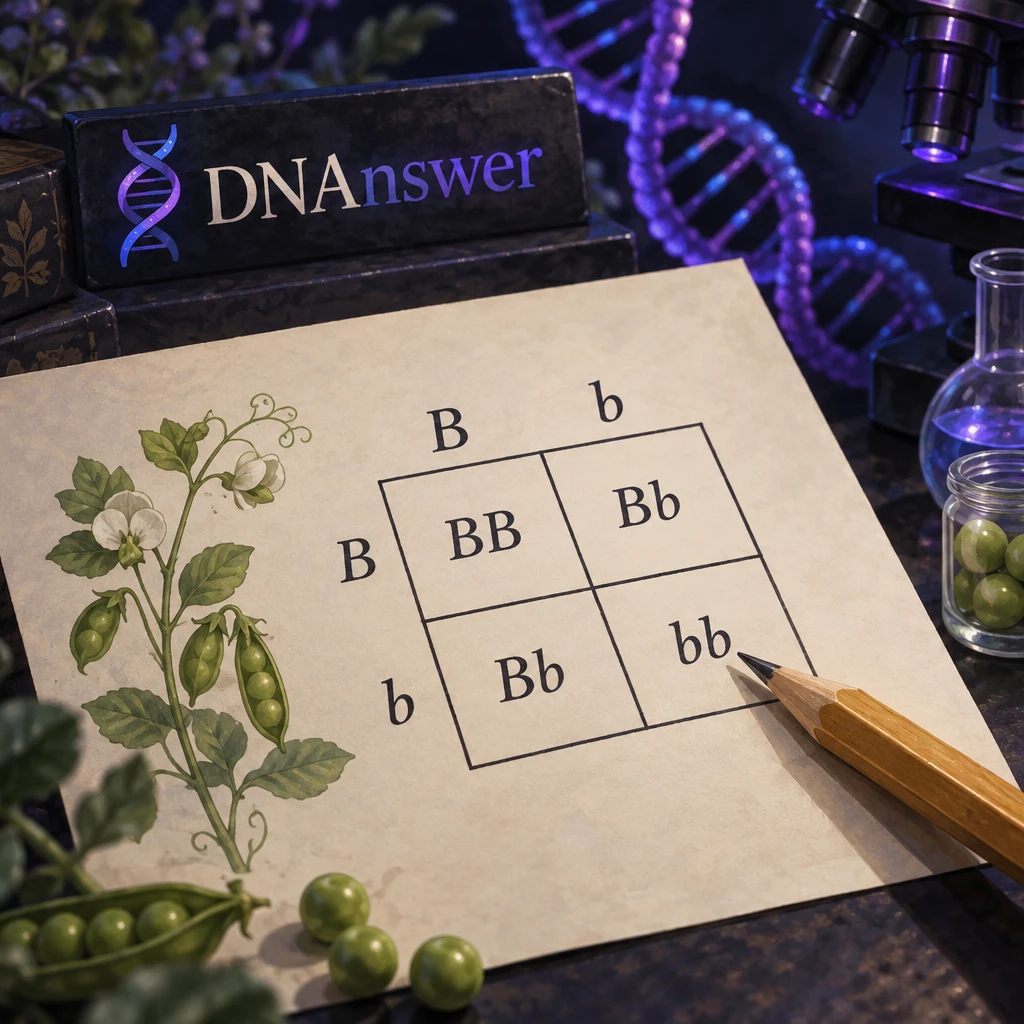
Why does a punnett square say 3:1, yet a family of four kids can show a completely different mix? Because the square predicts odds, not outcomes. Each child is a fresh coin flip.
This guide shows you how to build one step by step, for single-trait and two-trait crosses. Then it tackles the five beliefs that trip people up most.
Key Takeaways
- A punnett square gives probabilities, never guarantees for one child.
- Split each parent's alleles into gametes before drawing anything.
- A 3:1 phenotype ratio and a 1:2:1 genotype ratio describe the same cross.
- Dominant does not mean stronger or more common.
- Dihybrid crosses need a 4×4 grid with 16 boxes.
- Human eye color follows many genes, so a simple square misleads.
How to Build a Punnett Square: The Step-by-Step Method
Gregor Mendel never drew one. The Austrian monk counted pea plants in the 1860s and found the patterns. British geneticist Reginald Punnett invented the grid in the early 1900s, so you could see those patterns at a glance.
Start with a few terms. An allele is one version of a gene. A gamete is a sex cell (egg or sperm) that carries just one allele per gene. Homozygous means two matching alleles (BB or bb). Heterozygous means two different ones (Bb).
The six steps
Here is the method for a single-trait cross, called a monohybrid cross. We use pea flower color: purple (B, dominant) and white (b, recessive).
- Write each parent's genotype, meaning the letters for its alleles. Cross two purple-flowered plants that both carry the white allele: Bb × Bb.
- Split each parent into gametes. Each Bb parent makes two kinds: B and b.
- Draw a 2×2 grid.
- Put one parent's gametes across the top and the other's down the side.
- Fill each box by combining the letter above it with the letter beside it.
- Count the genotypes (the allele pairs), then the phenotypes (the visible traits).
The filled grid
The top row reads B and b. The side column reads B and b. The four boxes hold BB, Bb, Bb and bb.
Count the genotypes: 1 BB, 2 Bb, 1 bb. That is a 1:2:1 genotype ratio. Now count the looks. BB and Bb both give purple, because B hides b. Only bb gives white. That is three purple to one white, a 3:1 phenotype ratio, or 75% purple and 25% white.
One habit saves most errors: write capital letters first in every box (Bb, never bB). It makes counting faster and keeps identical boxes visibly identical.
Myth 1: "A 3:1 Ratio Means Exactly 3 of Every 4 Offspring"
Say a couple of pea plants produce four seedlings. You expect three purple and one white. You get two and two. Did the square fail?
No. The belief makes sense, because the grid has four boxes, and four boxes feel like four offspring. Many textbooks also show ratios in tidy whole numbers.
What the odds really mean
Each box is a chance, not a slot. Every seed gets its own roll: a 75% chance of purple, a 25% chance of white. The first seed does not affect the second, just as a coin doesn't remember its last flip.
Small groups swing wildly. With four seedlings, the chance that all four come out purple is 0.75 × 0.75 × 0.75 × 0.75, about 32%. That is roughly one in three, so it happens often.
Large groups settle toward the prediction. Mendel counted thousands of plants. In one famous set he saw 5,474 round and 1,850 wrinkled peas, close to the 3:1 he predicted.
What to do differently
Treat the ratio as a forecast over many offspring. For a single birth or a single litter, say "75% chance each," not "three out of four will." If you flip a coin four times and get three heads, you would not call the coin broken.
Myth 2: "Dominant Means Stronger or More Common"
The word sounds like a ranking. Dominant allele, dominant wrestler. It is easy to assume the dominant version wins in a population too.
The word does come from a real pattern. In a heterozygote like Bb, one allele shows and the other hides. Mendel called the visible one dominant. He was describing what you can see in that individual, nothing more.
Dominance describes how an allele shows up, not how healthy or widespread it is. Some dominant alleles are rare. Polydactyly (extra fingers or toes) follows a dominant pattern in many families, yet most people have five digits. Huntington's disease is also dominant, and it affects only a small fraction of people. Meanwhile, plenty of recessive traits are the norm. Type O blood comes from two recessive alleles, and it is the most common blood type in the United States.
What should you do differently? When you read a square, ask "which allele shows when both are present?" and stop there. Do not guess how common a trait is from which letter is capitalized. Only population data answers that.
Myth 3: "The 3:1 and 1:2:1 Ratios Are Two Different Predictions"
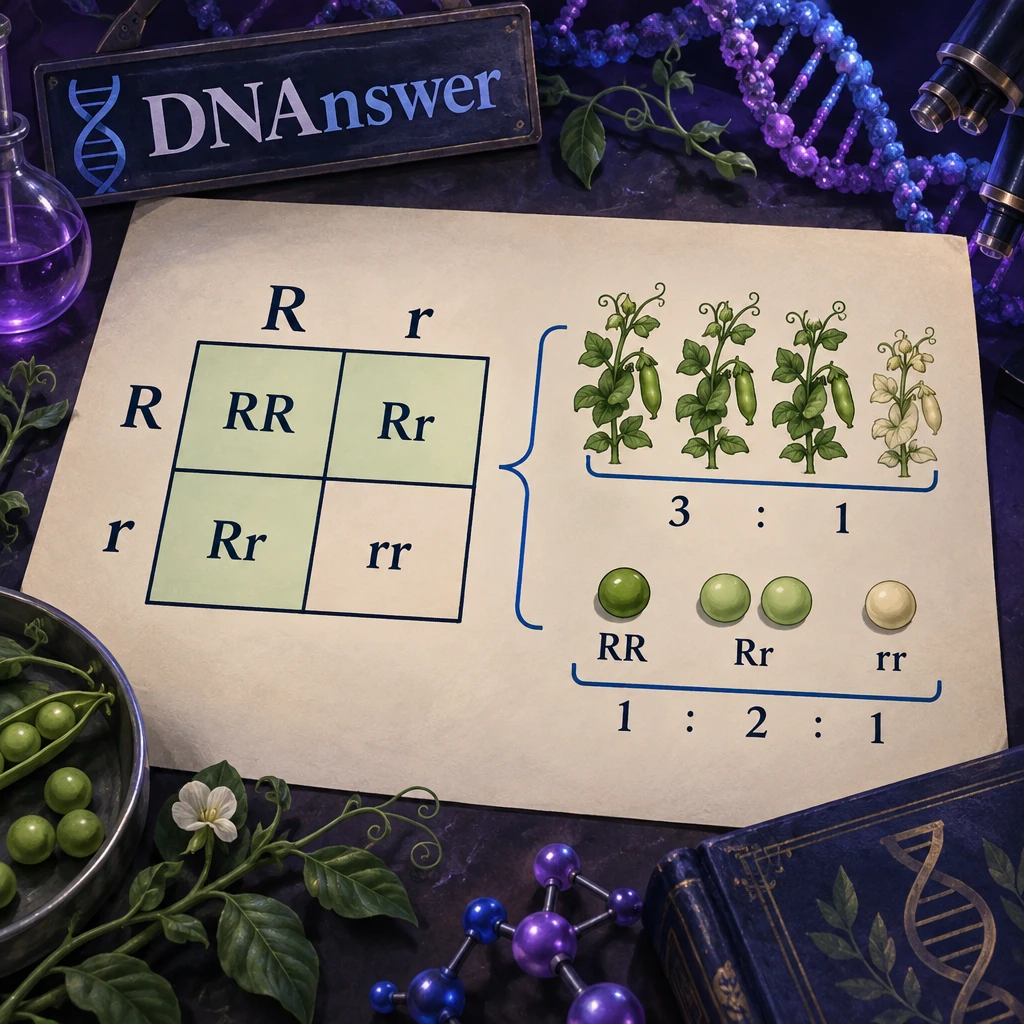
Students often find a 1:2:1 in the grid and then a 3:1 in the answer key. One of them must be wrong, right?
Both are right. They answer different questions. The confusion has an honest cause: the grid shows genotypes first, and your brain reads the numbers as one list.
Count the letters, then count the looks
Genotype is the allele pair in each box. Phenotype is what the organism looks like. In a Bb × Bb cross, you have three genotypes (BB, Bb, bb) but only two phenotypes (purple, white), since BB and Bb look identical.
So the 1:2:1 splits three groups apart. The 3:1 merges the first two into one visible group. Same four boxes, two ways to sort them.
Here is a quick test. If the problem asks "what percentage of offspring are heterozygous?" count only the Bb boxes: 2 of 4, or 50%. If it asks "what percentage show the dominant trait?" count BB and Bb together: 3 of 4, or 75%.
Common crosses at a glance
Memorize the logic, not a table. Still, a few results come up constantly. Bb × Bb gives a 1:2:1 genotype ratio and a 3:1 phenotype ratio. Bb × bb gives 1:1 for both, so half of the offspring show each trait. BB × bb gives all Bb, and every offspring shows the dominant trait. BB × Bb gives half BB and half Bb, and again every offspring shows the dominant trait.
Notice the last one. You cannot tell BB from Bb by looking, so a purple parent's genotype can stay hidden until its offspring reveal it.
Setting Up a Dihybrid Cross Without Wrecking the Grid
Two traits at once means a bigger grid, and bigger grids hide a classic mistake. A dihybrid cross tracks two genes together, such as seed color and seed shape in peas.
Mendel used yellow (Y) versus green (y), and round (R) versus wrinkled (r). Cross two plants that are both heterozygous for both traits: YyRr × YyRr.
Split the alleles correctly first
Each parent makes gametes that carry one allele from each gene. Never keep both letters of one gene together. Pair them like this:
- YR
- Yr
- yR
- yr
That is four gametes per parent. Many wrong grids come from writing Yy and Rr as gametes, or from dropping one combination. A quick check: multiply the options. Two choices for color times two for shape gives four.
Build the 4×4 grid
Place the four gametes across the top and the same four down the side. You now have 16 boxes. Fill each one with four letters, color letters first, then shape letters: YYRR, YYRr, YyRR and so on.
Count the looks. You get 9 yellow round, 3 yellow wrinkled, 3 green round and 1 green wrinkled. That is the famous 9:3:3:1 ratio, out of 16 boxes.
Here is a useful check. Look at color alone: 12 yellow to 4 green, which is 3:1. Shape alone: 12 round to 4 wrinkled, also 3:1. Mendel saw that each trait split on its own, which led him to his law of independent assortment. That law says one gene's alleles do not affect how another gene's alleles are passed on.
A shortcut for busy people
You can skip the big grid. Work out each gene as its own 2×2 square, then multiply. The chance of yellow is 3/4 and the chance of round is 3/4, so yellow round is 3/4 × 3/4 = 9/16. Green wrinkled is 1/4 × 1/4 = 1/16. This works because the genes assort independently, and it scales to three traits where a grid would need 64 boxes.
Myth 4: "A Punnett Square Can Predict Human Eye Color"

Classic school handouts show a brown-eyed and a blue-eyed parent in a neat 2×2. It looks convincing, and it gets repeated for a reason. Early 20th-century genetics did suggest brown was dominant over blue, and the idea stuck in textbooks.
Reality is messier. Human eye color involves many genes. Two of them, OCA2 and HERC2 on chromosome 15, matter most, but several others nudge the shade. The result is a spread from dark brown through green, hazel and blue, not two clean boxes. Blue-eyed parents can have a child with green or even light brown eyes, which a one-gene square would call impossible.
A Punnett square works well for traits controlled by one gene with clear dominance. Think pea seed shape, or cystic fibrosis, which follows a recessive pattern. It works poorly for height, skin color and eye color, which come from many genes plus environment.
What to do instead: use the square for the textbook single-gene cases it fits. For everyday human traits, treat any square as a rough teaching model, not a forecast for your future child.
Myth 5: "Mendel's Rules Explain Most Inheritance"
If the square predicts so well in peas, surely it covers most of life? Mendel's rules did explain a lot, and that is why they still anchor every genetics class. Still, they describe a slice of inheritance.
Where the grid breaks down
Several known patterns bend the rules. In incomplete dominance, a heterozygote looks like a blend: a red snapdragon crossed with a white one gives pink offspring. In codominance, both alleles show at once, as in human AB blood type. Linked genes sit close together on a chromosome and travel as a pair, which breaks the 9:3:3:1 pattern. Genes on the X chromosome add another twist, which is why red-green color blindness is more common in males.
Epigenetics: inheritance beyond the letters
Epigenetics means chemical tags on DNA that change how active a gene is without changing its letters. A May 2026 report covered by ScienceDaily described researchers at Texas A&M University, Johns Hopkins and the University of North Carolina at Chapel Hill finding inherited traits that break Mendel's expected ratios. The team plans to look for similar patterns in human genomic data, and says the work could help clinicians understand inherited disease and how diet might affect epigenetic inheritance across generations.
A Punnett square cannot show those tags, because it only tracks which alleles each parent passes on.
A monohybrid cross between two heterozygotes gives a 3:1 phenotypic ratio and a 1:2:1 genotypic ratio.
That sentence still holds for the cases Mendel studied. The square is a good model, and every model has an edge.
Practice helps you find that edge. If you want to test yourself after this walkthrough, the genetics quizzes on DNAnswer are free and add new questions regularly.
Two Quick Checks Before You Trust Your Answer
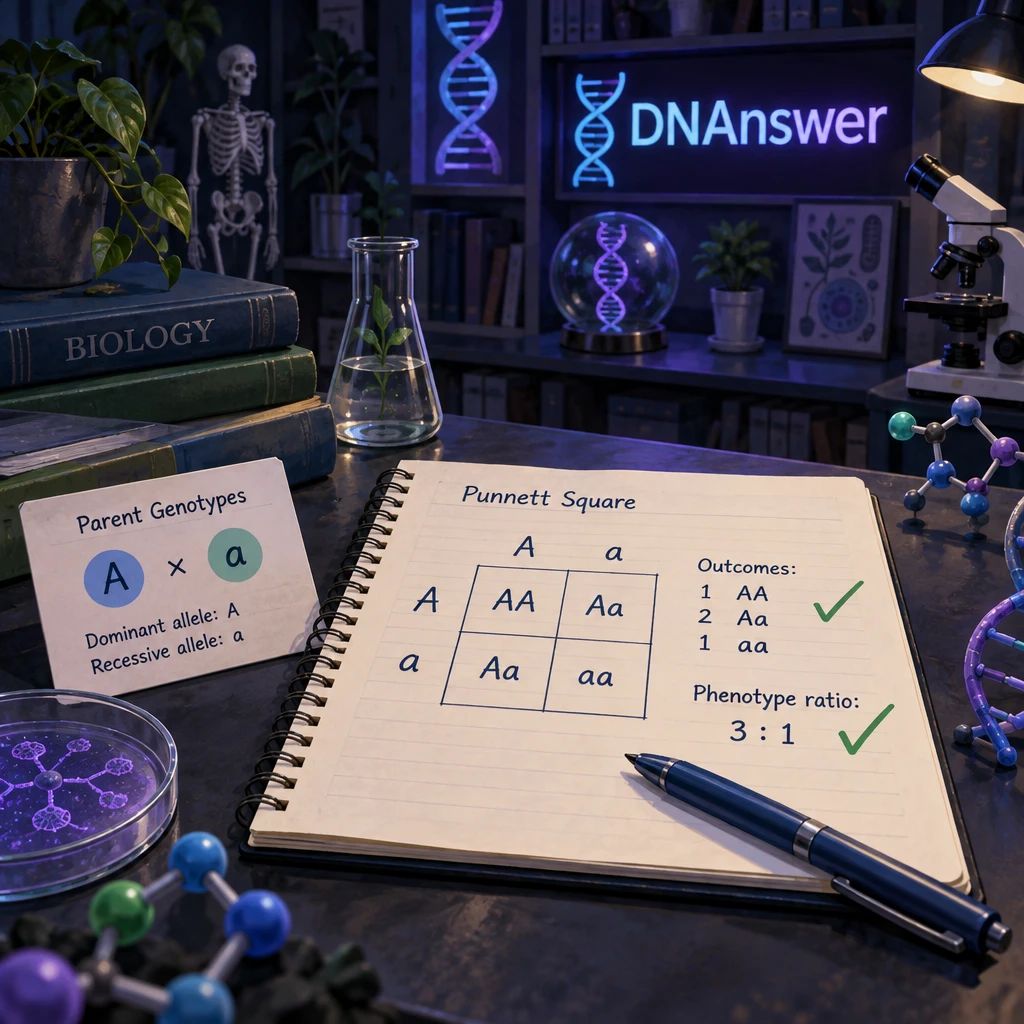
Even a correct method fails if one box is wrong. Run these before you write a final ratio.
First, count the boxes. A monohybrid square must have 4 and a dihybrid square 16. If you have fewer, you dropped a gamete.
Second, add the fractions. Your genotype boxes should sum to 100%. In Bb × Bb that is 25% + 50% + 25%.
If a question hands you the offspring and asks for a missing parent, work backward. A white-flowered offspring means both parents carried at least one b. A purple parent could be BB or Bb, so you need more clues, such as a white child, to decide.
Do You Need a Punnett Square Calculator?
Online calculators fill the grid in seconds, and they handle dihybrid and trihybrid crosses without a slip. They are handy for checking homework or planning a breeding cross for plants or pets.
Do the first few by hand, though. The grid is the point: it shows you why 9:3:3:1 appears. After five or six hand-built squares, switch to a calculator for speed and use it as a second opinion.
Conclusion
Use the square for what it does well: showing the odds when one or two genes with clear dominance drive a trait. Draw it by hand until the logic is automatic. Then treat every result as a chance per offspring, not a promise. When a trait involves many genes or epigenetic tags, trust the real data over the grid.
Frequently Asked Questions
How do you complete a Punnett square step by step?
Write both parents' genotypes, split each into gametes, and draw a grid. Put one parent's gametes across the top and the other's down the side. Combine the letters in each box, then count genotypes and phenotypes.
Does a 3:1 ratio mean exactly 3 of every 4 offspring show the dominant trait?
No. Each offspring has a 75% chance of showing the dominant trait, independent of its siblings. Small families often miss 3:1 by a wide margin, while large groups land close to it.
Can a Punnett square predict human traits like eye color?
Not reliably. Eye color depends on several genes, so a one-gene square oversimplifies it. The square fits single-gene traits, such as cystic fibrosis, much better.
How big is a Punnett square for a dihybrid cross?
It is 4×4, with 16 boxes. Each parent makes four gamete types, such as YR, Yr, yR and yr. A cross of two double heterozygotes gives the 9:3:3:1 phenotype ratio.